
What is a Prediction Problem?
A business problem which involves predicting future events by extracting patterns in the historical data. Prediction problems are solved using Statistical techniques, mathematical models or machine learning techniques.
For example: Forecasting stock price for the next week, predicting which football team wins the world cup, etc.
What is Regression analysis, where is it applicable?
What is Regression analysis, where is it applicable?
While dealing with any prediction problem, the easiest, most widely used yet powerful technique is the Linear Regression. Regression analysis is used for modeling the relationship between a response variable and one or more input variables.
In simpler terms,Regression Analysis helps us to find answers to:
- Prediction of Future observations
- find association, relationship between variables.
- Identify which variables contribute more towards predicting the future outcomes.Types of regression problems:
Simple Linear Regression:
If model deals with one input, called as independent or predictor variable and one output variable, called as dependent or response variable then it is called Simple Linear Regression. In this type of Linear regression, it assumes that there exists a linear relation between predictor and response variable of the form.
Y ≈ β0 + β1X + e.


In the above equation, β0,β1 are the unknown constants that represent intercept and slop of a straight line which we learned in our high schools. These known constants are known as the model coefficients or parameters. From the above equation, X is the known input variable and if we can estimate β0,β1 by some method then Y can be predicted.
In order to predict future outcomes, by using the training data we need to estimate the unknown model parameters (ˆ β0,ˆ β1) using the equation.
ˆy = ˆ β0 + ˆ β1x + ˆe,
Multiple Linear Regression:
If the problem contains more than one input variables and one response variable, then it is called Multiple Linear regression.
How do we apply Regression analysis using R?
How do we apply Regression analysis using R?
Let us apply regression analysis on power plant dataset available from here. The dataset contains 9568 data points collected from a Combined Cycle Power Plant over 6 years (2006-2011), when the power plant was set to work with full load. Features consist of hourly average ambient variables Temperature (T), Ambient Pressure (AP), Relative Humidity (RH) and Exhaust Vacuum (V) to predict the net hourly electrical energy output (EP) of the plant.


- Read the data into R environment:
require(xlsx)
sample1 = read.xlsx("C:\\Suresh\\blogs\\datasets\\CCPP\\Folds5x2_pp.xlsx",sheetIndex=1)
- Understand and observing the data: View(sample1)

Check for missing values, range of
variables, density plots for each of the varaible:
sum(is.na(sample1$AT))
[1] 0
range(sample1$AT) #1.81,37.11
mean(sample1$AT) #m: 19.65
plot(density(sample1$AT))
Plot(sample1)
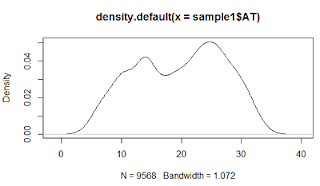

Density plot for Temperature


Scatter plots shows us that temperature (AT) and vaccum(V) are inversely related to power while pressure(AP) and RH are not related.
- Check for correlation among the variables. This step is very important to understand the relation of dependant variable with the independent variables and correlations among the variables. In general, there shouldn’t be any correlation among the independent variables.
'AT V AP RH PE
AT 1.0000000 0.8441067 -0.50754934 -0.54253465 -0.9481285
V 0.8441067 1.0000000 -0.41350216 -0.31218728 -0.8697803
AP -0.5075493 -0.4135022 1.00000000 0.09957432 0.5184290
RH -0.5425347 -0.3121873 0.09957432 1.00000000 0.3897941'
'inferences--> AT has -ve relation with PE
V is highly related to PE
other two are relatively related'
- Divide the data into training and test set and train the model with linear regression using lm() method available in R and thendo predictions on new test data using predict() method.
rand=sample1[sample(nrow(sample1)),]
tr = rand[1:6697,]
ts = rand[6698:9568,]
model2 = lm(PE~AT+V+AP+RH,data=tr)
summary(model2)
Call:
lm(formula = PE ~ AT + V + AP + RH, data = tr)
Residuals:
Min 1Q
Median 3Q Max
-43.533 -3.170 -0.068
3.229 17.451
Coefficients:
Estimate Std.
Error t value Pr(>|t|)
(Intercept) 457.729155
11.794172 38.810 < 2e-16 ***
AT -1.987307 0.018208 -109.147 < 2e-16 ***
V -0.231996 0.008692
-26.689 < 2e-16 ***
AP 0.059235 0.011442
5.177 2.32e-07 ***
RH -0.159916 0.005015
-31.886 < 2e-16 ***
---
Signif. codes: 0 ‘***’ 0.001 ‘**’
0.01 ‘*’ 0.05 ‘.’ 0.1 ‘ ’ 1
Residual standard error: 4.585 on 6692 degrees of freedom
Multiple R-squared: 0.9281, Adjusted R-squared: 0.9281
F-statistic: 2.161e+04 on 4 and 6692 DF,
p-value: < 2.2e-16
New predictions are made using predict method.
pred = predict(model,ts[,1:4])


The
above image shows the results of actual vs predicted which are quite accurate.
In the summary results of the model,
below are the key takeways:
- Model is accurate as R2 is near to 1 (0.912).
- Model states all the variables are significant, the *** indicate the significance.
- P-statistics is less than 0.05, F-statistics is significantly high.
- Residuals vs fitted plots and Q-Q normal plots are also good with mean variance of the errors around 0.

In
the next blog we learn about model validations and extensions in linear
regression.
However, its additional potential does not end here. AI can likewise support representative commitment by improving the organization culture. machine learning course
ReplyDeleteSuch a very useful article. Very interesting to read this article.I would like to thank you for the efforts you had made for writing this awesome article.
ReplyDeletedata science training in noida
You don't know how important this information has been for me. Thanks for sharing.
ReplyDeletecustom logo design company
Such a fabulous post, thanks for sharing it with us.
ReplyDeletelaw dissertation Writing Service
Proactive Men's Medical Center is an erectile dysfunction clinic that provides customized treatments that are designed to allow patients to regain and maintain an erection quickly, safely, and effectively even if brand name ED prescriptions were ineffective. Cincinnati ED men's clinic for erectile dysfunction
ReplyDeletevery nice post Thanks For Sharing with us if you are enjoying QuickBooks software and have face some issue the you should contact quickbooks customer service to dial atquickbook phone number +1 888-932-7932
ReplyDeleteQuickBooks enterprise application change in the accounting and bookkeeping industry.by use you can enhancing inventory receiving on transactions in QuickBooks Enterprise and run your business smoothly Our team will be happy to help you anytime so Feel free to dial our QuickBooks
ReplyDeletequickbooks support phone number+1 866-822-4745 nd get instant help with the best quickbooks customer service .
This comment has been removed by the author.
ReplyDeleteQuickBooks has an amazing feature if you are using QuickBooks and have some issue then you should contact our trustable team Quickbooks customer service by dial quickbooks customer service number +18555484814
ReplyDeleteWounderful Blog! I was reading this blog for the last night.It was really helpful and informative for me.If any one wants Hire Product Description Writers service.You can easily contact with me.
ReplyDeleteHi thanks for sharing thiss
ReplyDelete09666A5DDB
ReplyDeleteTakipçi Satın Al
TT İzlenme Hilesi
Tiktok Jeton Hilesi
ReplyDeleteWhen working on custom textile projects, it’s essential to choose the right materials to ensure quality results. Many artists and manufacturers rely on dtf transfer sheets for their durability and vibrant print capabilities. These sheets facilitate the transfer process, making it easier to achieve professional-looking designs. For those new to the industry, exploring options like dtf transfer sheets can be a game-changer. Ultimately, selecting the proper transfer sheets is crucial for producing long-lasting and eye-catching apparel.